RECENT WORK:
UNDERGROUND ACOUSTIC IMAGING AT FOLSOM RESEARCH INC.
| My primary work during 1998 through early 2001 was conducted on acoustic imaging in sand and soils at Folsom Research, Inc, under continued research funding from Gas Research Institute. Acoustic transducers were used to transmit sound wave pulses into the ground, to receive echos from underground objects like gas or water pipes, to condition received waveforms (e.g. filter by frequency band and derive real and quadrature information by FFT techniques), and to reconstruct 2-D and 3-D images of the subsurface environment. This was new and original technology research. National Instruments LabView was chosen for the data acquisition (DAQ) environment, because its software and hardware are ideal for the DAQ requirements, provide a very rapid development process, and employ well-designed graphical programming and user-instrument interface metaphors. |
||
| TRANSMISSION AND RECEPTION OF ACOUSTIC WAVES | ||
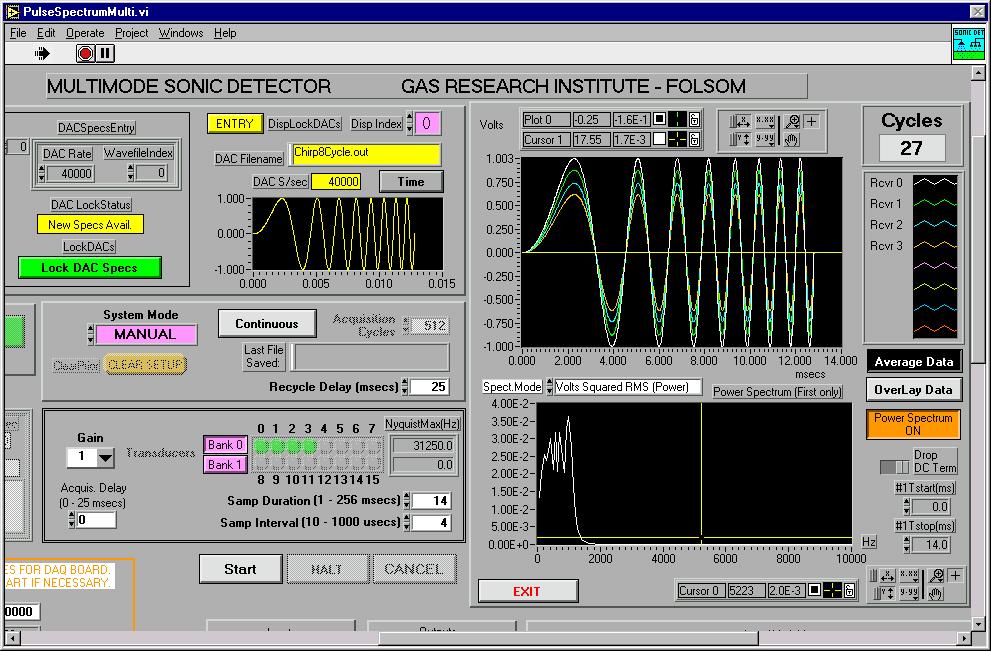
| One of the main acoustic methodologies at Folsom Research is pulse-echo technology, similar to sonar or radar. Shown here is one of my more complex LabView virtual instruments (VIs) currently in regular use. The image is of the central portion of the VI control panel and does not show all of the primary controls. | ||
 |
||
| This pulse-echo instrument has a number of important features. In terms of DAQ it supports (a) multiple output waveforms from previously defined disk files; (b) multiple output frequencies (DAC sampling rates) for each output waveform; (c) up to 16 user-selectable receiving channels in two banks; (d) real-time display of separate coherent running averages of the received echo traces for each receiving channel over a preset number of cycles; and (e) automatic recording of the final averaged echos for each receiver into separate disk files which are automatically named. In terms of user-friendliness it features (a) careful and active coding of controls by colors which change according to functional relationships; (b) channel color coding of displays of received echo data; (c) a comprehensive array of software logic control interlocks (such as disabling and greying-out which are supported through LabView control attributes) to prevent user errors which otherwise would handicap such a complex instrument; and (d) user-optional saving of the detailed control configurations to disk files for reuse in standard experimental set-ups. Normally the DAQ transducer hardware is interfaced to NI 16-bit multichannel E-Series PCI boards in the DAQ computer. Typical sampling rates are 20 Ksamples/s for the DAC output and for each ADC receiver channel. In the screen shot above, the output wave is the chirp at upper left, four received signals are superimposed in the display at upper right, and the power spectrum of first receiving channel is at lower right. For this image the DAC output was connected to a voltage divider chain across the ADC channels. In normal operation, duration of the ADC sampling is typically 25 milliseconds and the running average is over 256 pulse-echo cycles. | ||
| SYNTHETIC APERTURE IMAGE RECONSTRUCTION | ||
| The principle is similar to medical ultrasound imaging, except that a single sonic transmitter and a single sonic receiver were used together to synthesize a large linear aperture imager. Fourier techniques are used both for control of the acoustic spectrum and for image reconstruction. A cubical box (with 120 cm sides) was half filled with fine dry sand. A 1.25-inch OD capped, plastic pipe was buried at a depth of 23 cm in the center of the sand. A coordinate system was arranged to permit accurate positioning of the transducers. The transmitter was a custom enclosure containing a circular piezo-electric disk, which contacts the surface. The receiver was a custom PVDF (polyvynlidene diflouride) thin film pressure transducer with preamplifier in a small enclosure. The receiver was designed and produced by colleague Douglas Niessen. The two transducers were aligned parallel to the axis of the buried pipe, and were relocated, in the synthesis of the linear aperture, along a line on the surface perpendicular to the axis of the buried pipe. Great care was taken to keep constant both the transmitter-receiver separation and the contact area of the transmitter disk. The transmitted signal was a tapered 2-cycle sine wave at 3000 Hz. The echo signals were sampled for 10 msec at 40K samples/sec. Multiple echoes were averaged at each point, and the points were spaced at 1.27 cm intervals along the aperture. Each such echo average is called an A-Trace. The length of the linear synthetic aperture was 56 cm. |
||
|
||
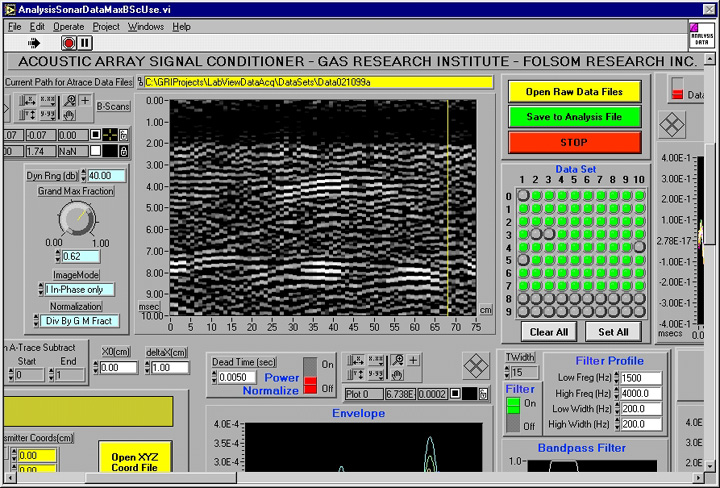
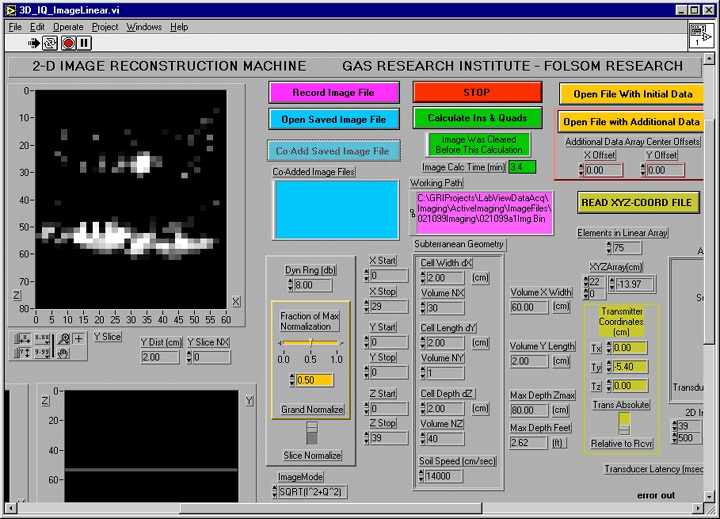
| The picture above shows the LabView virtual instrument used to prepare the A-Trace data files for the image reconstruction program. The graph is a B-Scan display, in which the A-traces are displayed side-by-side with time extending downward and distance along the aperture increasing from left to right. The strong direct surface wave signals have been mathematically suppressed for distances corresponding to a depth of about 14 cm (2.0 msec). The A-traces are represented in the B-scan display by their positive in-phase amplitudes, with negative values set to zero. This representation permits easy inspection of the received phase coherence. The data shown above were taken on 10 February 1999. Image reconstruction is accomplished by processing the A-trace echo data. For a linear aperture, a plane is constructed mathematically containing the aperture (and target pipe) and extending perpendicularly downward into the ground. The next picture shows the LabView reconstruction instrument, with the 2-dimensional aperture synthesis image reconstructed from the A-trace data above. |
||
|
||
| The picture is a snapshot of the aperture synthesis reconstruction engine built in LabView. The reconstruction pixels are set at 2 cm cubes in a vertical plane running perpendicular to the pipe. The graph is an intensity display of the image plane and the units are cm. The cross section of the bottom of the box and the slice through the pipe are clearly visible. The velocity of sound, based on separate measurements, is set at 14000 cm/sec. The dynamic range in displayed intensity has been restricted to 8 db to enhance the visibility of the target over the clutter. |
| Stephen L. Knapp | sknapp@nccn.net |
| 14069 Jokers Wild Lane, Grass Valley, CA 95945 | 530-263-4977 |
|
|